
What Is Pipeline Coverage? Ratio, Formula, Why It Lies
Pipeline coverage is open pipeline divided by target. Learn the formula, a worked example, and why stale and double-counted deals make the ratio lie.


CEO of ZUUZ. He scaled Cloud Box Technologies from 0 to $25M ARR in IT services and distribution before building ZUUZ. Connect on LinkedIn
TL;DR: Pipeline coverage is the value of open pipeline divided by the sales target for the same period, so $6M of pipeline against a $2M target is 3x. The arithmetic is simple, but the ratio is only as honest as the deals underneath it, and stale stages, deals with no buyer reply in weeks and double-counted multi-vendor reseller deals all inflate it. ZUUZ is an AI layer over Salesforce, HubSpot, Zoho, Attio or Pipedrive that keeps stages and stakeholders current from email, LinkedIn messages and Teams transcripts, so the deals in the ratio reflect real conversations, and it does not forecast.
- Pipeline coverage is open pipeline value divided by the target for the same period, written as a multiple such as 3x.
- The pipeline coverage formula needs written counting rules, or two people report two different ratios.
- Coverage can be cut by stage, rep, period and deal type, and each cut answers a different question.
- Multiples such as 3x or the inverse of the win rate are category practices, and both inherit the errors in the CRM.
- Stale stages, silent buyers, moving close dates and double-counted multi-vendor deals inflate the ratio.
- The Pipeline Truth Test checks the top five deals for dated buyer evidence; ZUUZ keeps that evidence in the CRM and does not forecast.
Picture a CRO two days before a board meeting. The dashboard says pipeline coverage is 3.4x and the slide is built. One question is open: if the CEO asks which deals make up that number, can anyone say?
That question is the whole subject. The target is a decision someone made, but the pipeline is a set of records that reps updated, or did not, at various points in the quarter. A clean ratio on unverified records is a confident number with nothing behind it.
This guide covers the definition, the formula with a worked example, cuts by stage, rep and period, what a good ratio looks like, why it lies, and how to test the deals inside it.
What Is Pipeline Coverage?
Pipeline coverage is the ratio of open pipeline value to the sales target for a defined period. A team with $6M of qualified opportunities closing this quarter and a $2M target has 3x coverage. Anyone asking what is pipeline coverage is after exactly this: one multiple showing whether enough deals are in play to hit the number.
Not every deal closes, so a target needs more pipeline behind it than the target itself. Salesforce describes pipeline coverage in its sales pipeline guide as a way to see whether the deals in play are enough to meet revenue goals, with high coverage suggesting good odds and low coverage suggesting the team needs more leads.
Sales pipeline coverage measures the stock of deals, not which ones will close. That matters because a ratio looks authoritative in a way that a forecast, which everyone knows is a guess, does not.
The Pipeline Coverage Formula and a Worked Example
The pipeline coverage formula is short: pipeline coverage ratio = open pipeline value for the period / sales target for the same period. The hard part is not the division. It is deciding what counts as open pipeline, and writing that decision down.
How to calculate pipeline coverage, in four steps:
- Set the target for the period, such as new-business bookings for the quarter.
- Filter opportunities whose expected close date falls inside that period and whose stage is past an agreed entry point.
- Sum the amounts of those opportunities.
- Divide the sum by the target.
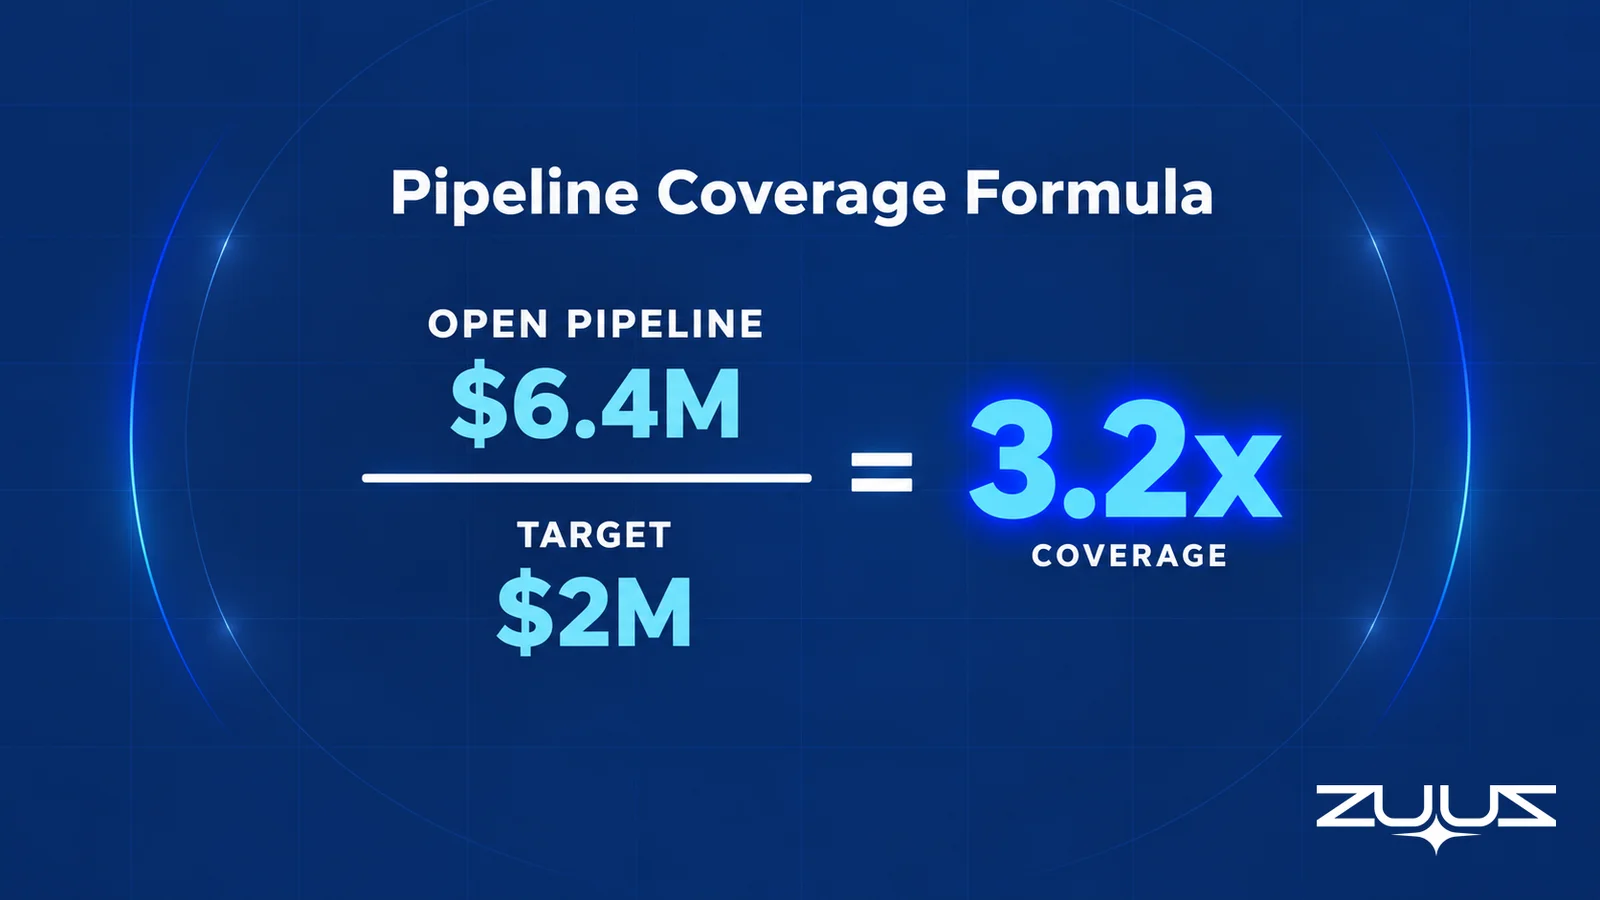
The denominator is a choice too. The full-period target suits planning at quarter start; the remaining target (target minus bookings already won) suits an in-period decision. Either way, the numerator needs the same scope and cutoff date.
Document the counting rules too: which stages, which close dates, whether renewals and expansion are included, and whether amounts are weighted. Without them, two coverage numbers appear in the same meeting.
An illustration with made-up figures, labeled as such. A team has a $2,000,000 new-business target for the quarter. The CRM report shows open opportunities with a close date in the quarter:
| Stage | Open deals | Value in CRM |
|---|---|---|
| Discovery | 14 | $1,900,000 |
| Evaluation | 9 | $2,000,000 |
| Proposal | 6 | $1,500,000 |
| Negotiation | 3 | $1,000,000 |
| Total | 32 | $6,400,000 |
Coverage is $6,400,000 / $2,000,000 = 3.2x, and it stays 3.2x until someone asks what is inside it.
Put Current Deal State Under the Coverage Number.
See how ZUUZ reads the deal thread and writes structured updates back to the CRM, so the deals in a coverage ratio carry current stages and stakeholders.
How to Cut the Ratio by Stage, Rep and Period
One team-wide multiple hides more than it shows. Slicing the same arithmetic four ways answers four different questions, and a saved report, as covered in the guide to CRM reporting, builds each one.
| Cut | Numerator | Denominator | What it shows |
|---|---|---|---|
| By stage | Pipeline value in each stage | Team target | How much of the ratio sits in early stages that are least likely to convert |
| By rep | One rep's open pipeline | That rep's quota | Which reps are thin and which are carrying a ratio on a few large deals |
| By period | Pipeline closing in a given month or quarter | Target for that period | Whether this quarter is covered, or whether next quarter's pipeline is hiding a gap |
| By deal type | New, expansion or renewal pipeline | Target for that type | Whether a healthy total is propped up by one motion |
Team coverage is not the average of rep coverage, because quotas differ and one oversized deal can lift a rep and the total together. Renewals deserve their own cut, as described in the guide to renewal tracking software, so a flattering total is not built from contract dates alone.
What a Good Coverage Ratio Looks Like
No universal right ratio exists. A 3x multiple is the common rule of thumb, and teams with long cycles or low win rates often need more. What counts as good depends on cycle length, deal size and how often pipeline has converted historically.
Two category practices come up often. The first derives the target multiple from the historical win rate: if one dollar in four of past pipeline became bookings, the arithmetic points to roughly 4x. The second is weighted coverage, where each deal is multiplied by a stage-based close probability before summing. Neither is a ZUUZ output, and neither is a forecast.
Both borrow history from the CRM, so a win rate calculated from stage records that were updated late is only as reliable as those records. The tooling category for this view is mapped in the guide to sales pipeline management software.
See Which Deals in the Ratio Have Real Buyer Activity.
ZUUZ connects to the sales inbox and LinkedIn messages and writes the evidence to CRM fields, so a coverage number can be traced deal by deal.
Why the Pipeline Coverage Ratio Lies
The ratio counts every dollar equally, whether the buyer replied yesterday or in the spring. The broader reasons CRM data drifts are in why your CRM pipeline is wrong; this section stays on the arithmetic.
Stale stages
A deal that entered Proposal six weeks ago and has not moved still adds its full value. Stage records the last update, not where the buyer is today.
No buyer reply in weeks
Rep activity makes a deal look alive, but a deal whose last customer reply is weeks old is closer to a hope than a pipeline entry. Sales activity tracking at the buyer level shows it first.
Double-counted multi-vendor deals
Resellers often attach one customer request to several vendor lines. Illustration: a customer asks a value-added reseller for a refresh covering networking, security and cloud. The CRM holds three opportunities, each carrying the full $400K budget, so coverage counts $1.2M against one request. The pattern is explored in the guide to IT VAR sales pipeline.
Close dates that keep moving
A close date pushed month after month keeps a deal in a period it will not close in, which is the mechanism behind deal slippage.
Inflated deal amounts
Amounts copied from an early estimate raise the numerator with no buyer scope behind them. An amount the buyer has not seen in writing is a placeholder.
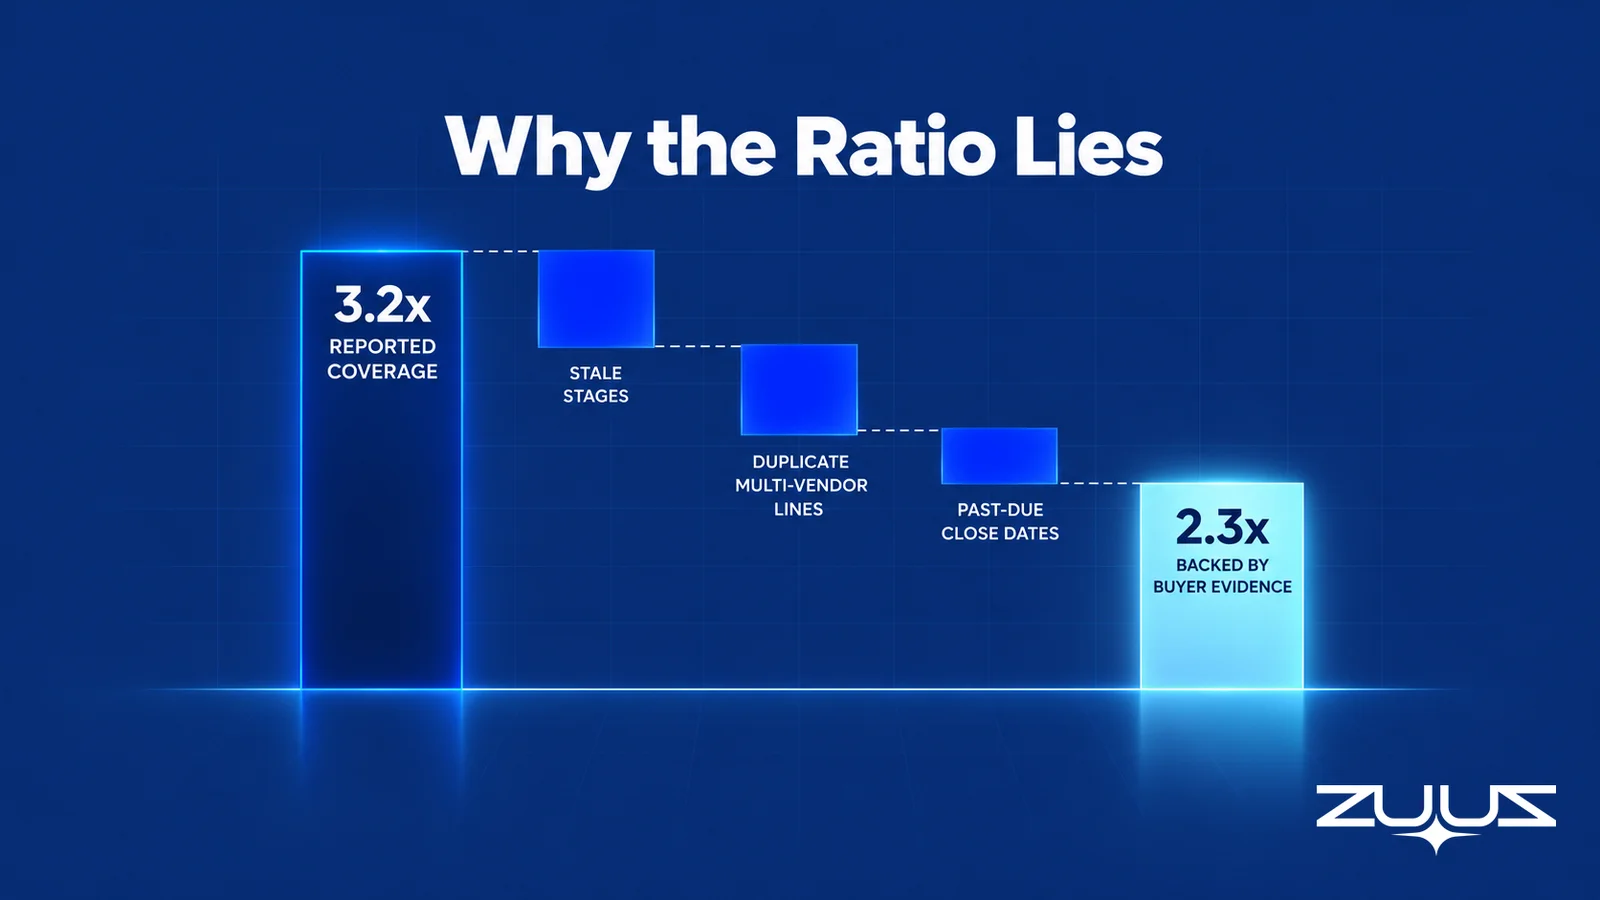
Applied to the earlier illustration, those checks show how far a ratio can fall without a deal being lost:
| Adjustment | Value |
|---|---|
| Pipeline counted in the CRM | $6,400,000 |
| Deals on a stage unchanged for six weeks or more with no buyer reply in three weeks | -$1,100,000 |
| One customer request counted on three vendor lines (two duplicate lines removed) | -$400,000 |
| Deals with a close date already in the past | -$300,000 |
| Pipeline backed by current buyer evidence | $4,600,000 |
$4,600,000 / $2,000,000 = 2.3x. Same team, same quarter, and the ratio moved from 3.2x to 2.3x. That gap is the distance between the number reported upward and the number that can be defended.
How to evaluate whether a pipeline coverage number can be trusted
- Dated buyer evidence. Can every stage and close date in the numerator be traced to something the buyer wrote, with a date on it?
- A capture layer. Does anything put the deal thread into CRM fields, not just an activity feed, without the rep retyping it?
- Stage age visible. Does the report show how long each deal has sat in its stage, so stale value can be excluded?
- One thread, one opportunity. Can duplicate lines for the same buyer request be spotted before they are summed?
- Rep correction in one click. When something is written for the rep, can the rep fix or reject it before it saves?
The Pipeline Truth Test Applied to the Ratio
Run this once against the current number. It takes about twenty minutes and answers a narrower question than the ratio does: is the pipeline coverage figure measuring deals, or measuring recollection?
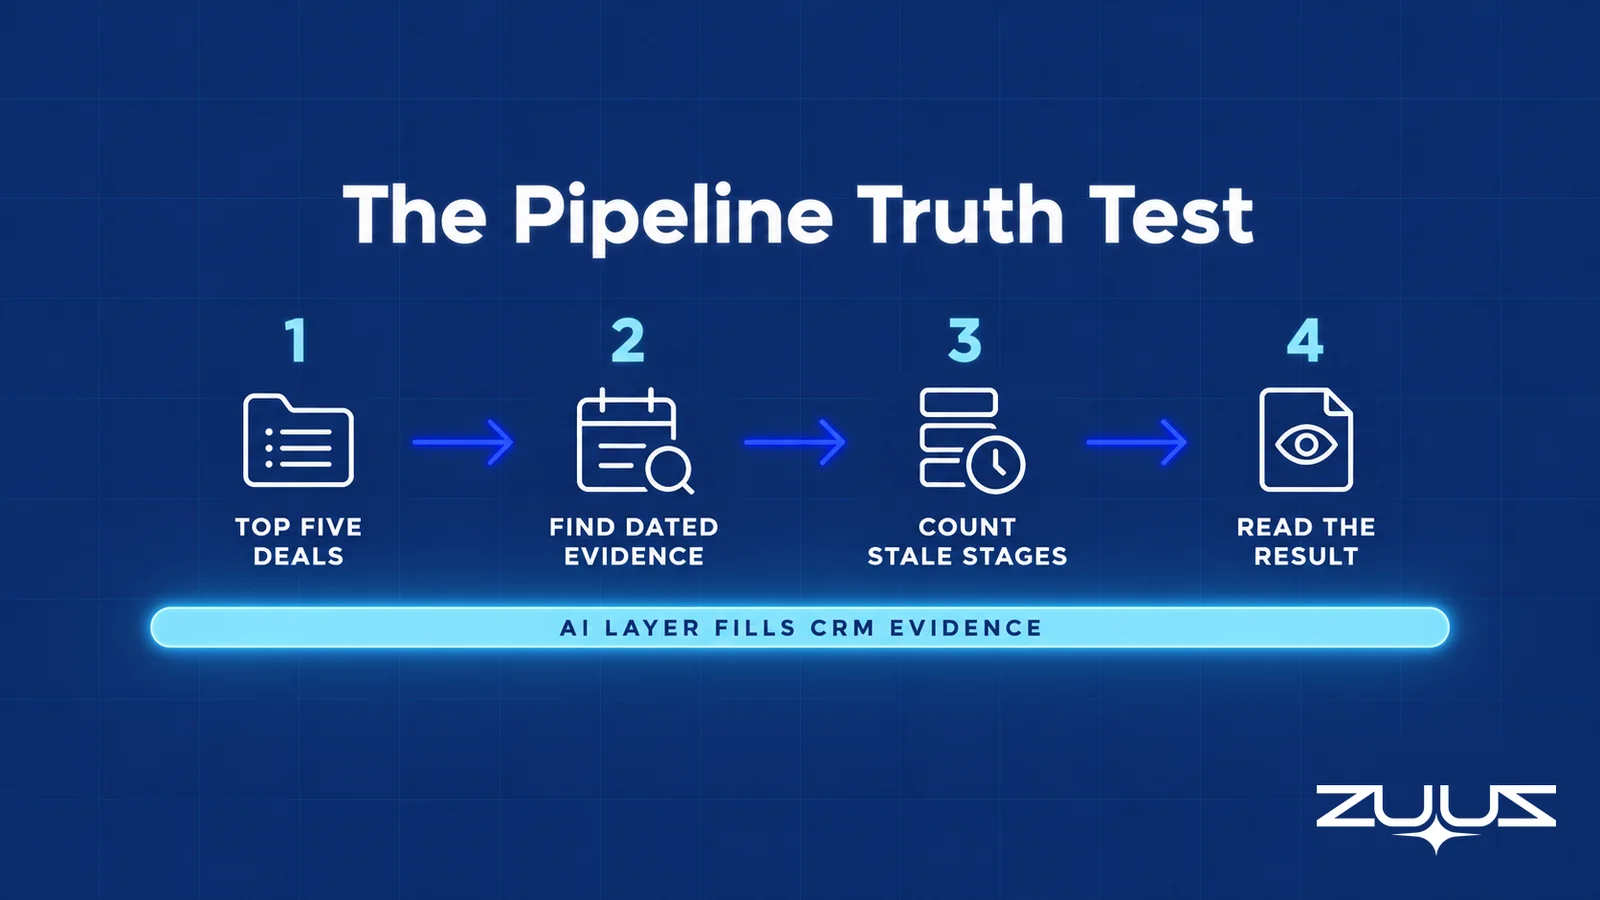
- Take the top five deals by value in the current quarter.
- For each, find the evidence in the CRM for its stage and close date, a dated, written commitment, not a rep's assurance.
- Count how many rest on a stage last changed more than two weeks ago.
- A pipeline in which most of the top five lack dated evidence is a forecast of rep optimism. ZUUZ does not forecast; it makes the record underneath the number real.
Worked example. In the illustration above, two of the top five deals sit in Negotiation with a stage last changed seven weeks ago and a close date set by the rep. One has a procurement reply in the thread asking for a revised scope, which is in no field. Those deals fail steps two and three, so the next move is a dated commitment from the buyer, not a debate about confidence. The same discipline applies in a weekly sales pipeline review.
Run the Test on a Real Mailbox, Not a Spreadsheet.
Connect one mailbox, let ZUUZ read the last 90 days, and compare what was said on the top deals with what the CRM holds.
The Operator View of Coverage
Having run sales in IT services and distribution, Avinash Gujje, CEO of ZUUZ, has watched the same pattern repeat: coverage is the number leadership trusts most and checks least, precisely because it is arithmetic. A forecast invites argument. A ratio of 3.4x invites a nod.
The part teams do not plan for is the age of the stage rather than the size of the deal. In distribution, one customer request routinely fans out into several vendor quotes, each its own opportunity. Nobody inflates the number on purpose; the CRM cannot tell that three lines belong to one conversation, so the report adds them up.

The fix that held was unglamorous: the owners of the number looked at the five largest deals weekly and asked for the buyer's last written words, not the rep's summary. The Pipeline Truth Test formalizes that habit, and it touches the wider revenue leakage question of what the record never captured.
Keeping the Deals Under the Ratio Real: How ZUUZ Helps
ZUUZ does not calculate pipeline coverage and does not forecast. The ratio stays a report in the CRM. What changes is the quality of the deals feeding it.
ZUUZ is an AI layer on top of the CRM a team already runs, with no migration. It connects to the sales inbox, calendar, LinkedIn messages (read-only), Teams meeting transcripts and inbound call transcripts, and writes structured stages, contacts and stakeholders to Salesforce, HubSpot, Zoho, Attio or Pipedrive. The rep approves the finished work in one click, and a 90-day mailbox lookback means history is not blank.
So a deal in a coverage report can be traced to the thread behind it, and Analytics reports pipeline at risk in dollars and what changed. The wider tool category is covered in IT sales pipeline visibility tools.
In the proof so far, a US-based IT services company, RA Technologies, ran ZUUZ on the HubSpot instance it had used for two years, with the same team, and $120K in pipeline was surfaced in the first 30 days that the CRM had never seen, captured from the sales mailbox. At Cloud Box Technologies, a UAE cloud and IT services business, one connected user tracks 10 to 12 renewals in minutes and leadership sees live pipeline.
The first step is small: connect one mailbox, let ZUUZ read the last 90 days, and compare the top five deals in the coverage report with what the threads say. The gap shows up in minutes, and CRM data quality becomes visible before the next board slide is built.
Frequently Asked Questions
What is pipeline coverage?
Pipeline coverage is the ratio of open pipeline value to the sales target for the same period, written as a multiple. A team with $6M of qualified pipeline against a $2M target has 3x coverage. It measures pipeline relative to the goal, not which deals will close.
How do you calculate pipeline coverage?
Divide the value of open opportunities expected to close in the period by the target for that period. Filter by close date and an agreed minimum stage, sum the amounts, then divide. For example, $6,400,000 of qualifying pipeline against a $2,000,000 target gives 3.2x.
What is the pipeline coverage formula?
Pipeline coverage ratio equals open pipeline value for the period divided by the sales target for the same period. Weighting each deal by stage probability first gives weighted coverage; the unweighted version is easier to audit because every dollar traces to a deal.
What is a good pipeline coverage ratio?
It depends on the team. Many use 3x as a rule of thumb, while others derive the multiple from historical win rate, so a one-in-four win rate points to about 4x. No ratio is universal, and the number only means something if the deals underneath it are real.
Why is my pipeline coverage ratio inflated?
The numerator is counting deals that are not moving. Common causes are stale stages, deals with no buyer reply in weeks, close dates pushed forward repeatedly, inflated amounts, and multi-vendor reseller deals counted once per vendor line. Each adds full value without adding a real chance of closing.
Is pipeline coverage the same as a sales forecast?
No. Pipeline coverage describes how much pipeline exists relative to the target. A forecast predicts how much will close. Coverage makes no prediction itself. ZUUZ does not forecast; it keeps the CRM record underneath a coverage number current so the number can be defended.
How do you check whether the deals in your pipeline coverage number are real?
Run the Pipeline Truth Test. Take the top five deals by value, find dated written evidence in the CRM for each stage and close date, and count how many rest on a stage unchanged for more than two weeks. Mostly undated means the ratio reflects rep optimism.
Which deals should count toward sales pipeline coverage?
Count open opportunities with a close date in the period and a stage past an agreed entry point, such as a qualified discovery call. Exclude closed-won deals, duplicates and deals whose close date has passed. A broader definition raises the ratio without raising the real chance of hitting the target.
How do multi-vendor reseller deals distort pipeline coverage?
A reseller often records one customer request as several opportunities, one per vendor or product line, each carrying the full budget. Coverage then adds the same demand more than once. The fix is to link the lines to one buyer thread and count the request once.
Does ZUUZ calculate pipeline coverage?
No. The ratio remains a report in the CRM. ZUUZ is an AI layer over Salesforce, HubSpot, Zoho, Attio or Pipedrive that captures stages, contacts and stakeholders from email, LinkedIn messages and Teams transcripts and writes them to the CRM. It does not forecast or score win probability.
A first step smaller than a rollout. Connect one mailbox. ZUUZ reads the last 90 days and the rep reviews what it found before anything is written to the CRM. Whatever that surfaces on the top five deals is the honest input for the next pipeline coverage report. 30-day free trial, no credit card: https://zuuz.ai/trial/